
The Wednesday Weekly
December 3rd, 2025

Weekly Market Insight
Welcome to our weekly market update. This newsletter is designed to provide you with current market data, investment insights, and educational information about market trends and strategies. The content herein represents our observations and analysis of market conditions and is intended for informational and educational purposes only. It does not constitute personalized investment advice or a recommendation for any specific security or strategy.
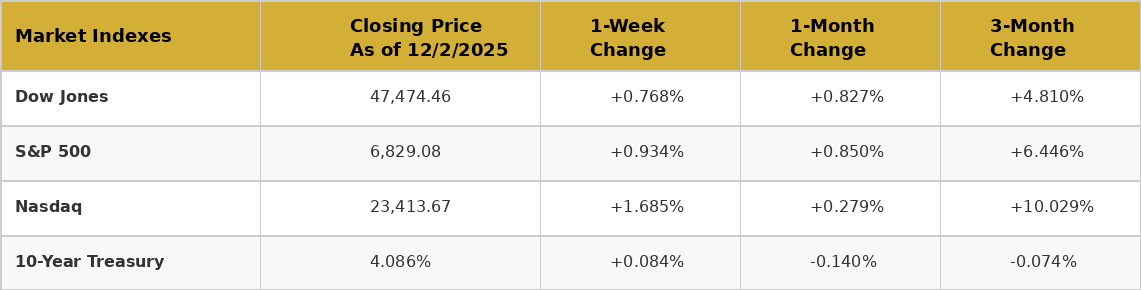
Major Market Indexes
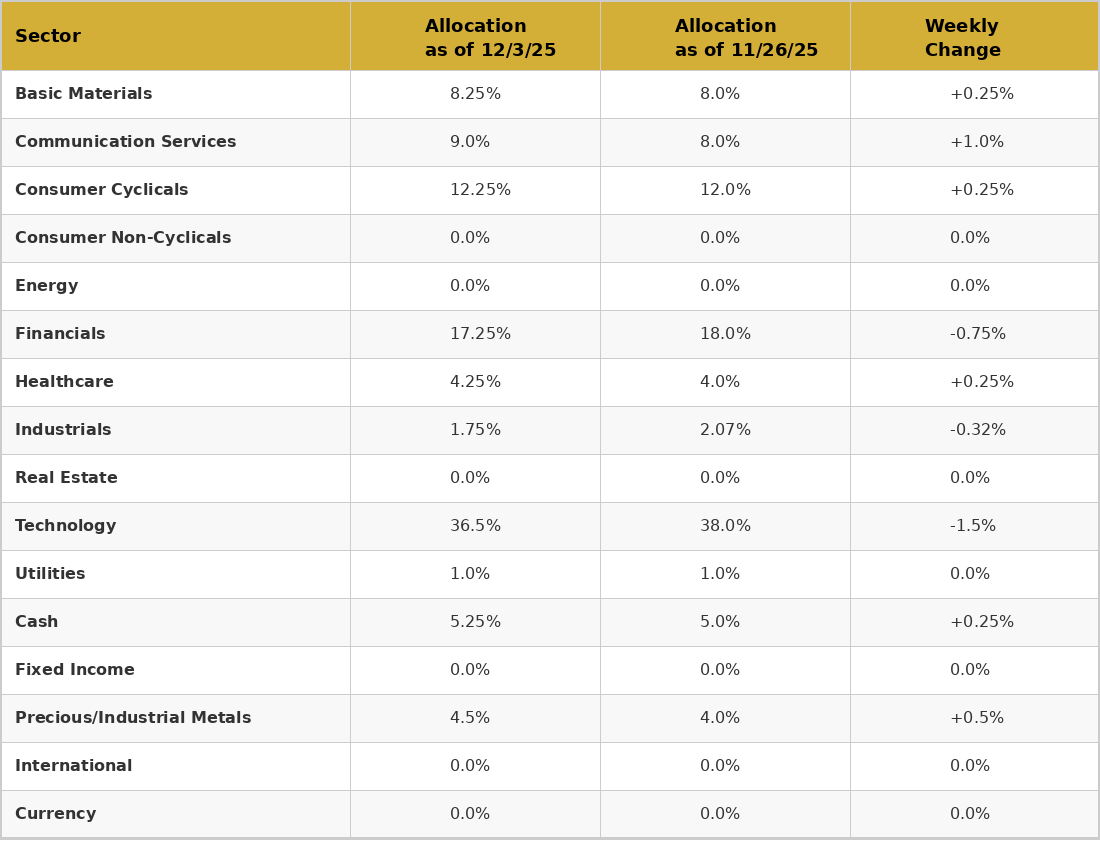
Current Strong Tower Model Allocation
The Strong Tower Difference
Relative Strength/Momentum
Relative strength and momentum investing are strategies that buy assets that are already performing well and avoid or sell assets that are performing poorly.
Relative Strength (RS): Compares performance across assets (e.g., which stock or sector is outperforming others). You buy the strongest performers relative to its peers.
Momentum: Looks at an asset’s own trend over time (e.g., is it going up consistently?). You buy assets with strong upward momentum and avoid those trending down.
Ask Yourself…
What do you own?
Why do you own what you own?
Do you know what you’re truly paying for your investment management and advice?
Sector Rotation
Sector rotation is an investment approach that adjusts portfolio exposure across different economic sectors based on expected market or economic conditions.
Relevance in investment management is used to seek potential opportunities and manage risk by aligning investments with sectors that may perform relatively better under prevailing market conditions.
Items of Interest
Santa Claus Rally
The Santa Claus Rally is a stock market pattern where U.S. stocks often rise during a specific 7-day period: the last 5 trading days of December and the first 2 of January. It’s commonly attributed to lighter holiday trading, improved sentiment, year-end portfolio moves, and new January investment flows. Historically, this period has shown above-average returns, and a weak Santa Claus Rally is sometimes viewed as a caution signal for the near term.
Market Seasonality
Historically, U.S. equities exhibit a strong seasonal pattern in which most market gains occur between November and April—the “seasonally strong” half of the year. The weaker period, May through October, has delivered much lower returns on average, giving rise to the well-known adage “sell in May and go away.”
The most recent seasonally weak period (May–October 2025) was unusually strong, with the Dow Jones Industrial Average gaining 16.95%, its best weak-period performance since 2009.
Seasonal extremes illustrate this pattern:
Best strong period: 1986 (+29%)
Worst strong period: 1970 (–14%)
Best weak period: 1958 (+19%)
Worst weak period: 2008 (–27%)
Only eight of the past 74 weak periods delivered double-digit gains, including this year’s +16.95%. Eleven weak periods have lost more than 10%, with 2008 the most recent. The weak-season loss in 2022 ended a six-year streak of positive returns—tied for the longest ever. Only seven instances of back-to-back negative weak periods have occurred, most recently in 2022–2023.
While seasonality is not a precise risk-management tool, it highlights market biases. The most recent “weak” period produced a surprisingly strong gain, influenced partly by the post–”Tariff Tantrum” rebound in April. Entering the seasonally strong period, equities are elevated and show some froth, yet remain top-ranked in asset-class strength, suggesting solid intermediate- and long-term momentum for U.S. stocks.
Tax-Loss Harvesting
As year-end approaches, investors often review taxable accounts for opportunities to reduce tax liability. Tax loss harvesting—selling positions at a loss to offset realized gains—is a simple but effective tool for this. Despite the S&P 500’s strong 16.1% gain year-to-date (through 12/1), there remain technically weak S&P 500 stocks down more than 10%, providing potential candidates.
Realized losses can offset gains taken earlier in the year or be carried forward into future years. However, the wash sale rule prevents claiming a loss if the same or a substantially identical security is repurchased within 30 days. This makes it important to harvest only from positions unlikely to rebound in the near term—hence the focus on technically weak names rather than all stocks showing YTD losses.
Forward-Looking Data
December is historically one of the strongest months for stocks:
Average monthly return ≈ +1.3%
~73–75% of Decembers finish positive
Daily volatility in December is relatively mild:
Average intraday range ≈ 0.9%
Seasonal flows (Santa Claus Rally, year-end positioning) support strong performance.
Bottom Line:
The last several months have provided a variety of concerns: Tariff fallout, Tech evaluations due to AI, continuing conflicts in the Middle East and Ukraine, interest rate cuts and government shutdowns to mention the most obvious.
Regardless of the headlines, the markets have continued to show overall strength and areas of opportunity. Particularly in: Tech/Communication Services/Financials.
We have seen recent improvement in Healthcare with recent weakening in Energy.
69.18% of our model is currently in the top 4 Industry Groups.
93.52% of our model is currently in the top 8 Industry Groups.
Merry Christmas!
Brett Lewis
Founder/Managing Director
Strong Tower Wealth Management
www.strongtowerwealthmanagement.com